Améliorer la description des images satellites à l'aide de données SIG [EN]
09/03/2019, by Clément PUECH
In a time of constant growth of data flows relating to satellite imagery, it has become a necessity to find alternatives to optimize their management.
This article offers a way to solve this issue by using an approach based on the different types of information contained in these images, with the ultimate goal of improving object detection algorithm’s training.
The idea here is to regroup the set of information that composes the content of satellite images in order to present a form of help in the selection of the data which will be fed to the AI.
Basically, it means setting up support in the enrichment of critical sites to improve the detection performances using AI, to ultimately provide an analysis of the zone thanks to geospatial intelligence.
With the recent boost of Earth Observation satellites sent in orbit, the amount of satellite imagery has increased significantly. These images are numerous and all different from one another. In fact, from the hundreds of thousands of images owned by Earthcube, a significant part remains unused due to the lack of information about their content (multiple dates per site).
In the context of training object detection algorithms, it is necessary to develop specific tests or training datasets. That’s why it is important to know the content of these images. In simple terms, the better you know your data, the better you can decide if they are worthwhile for your algorithms’ training.
It is, therefore, necessary to develop a detailed knowledge of satellite images, in order to determine which images would be the most likely to be relevant for the construction of datasets that meet specific criteria.
The solution that was thought through is based on the establishment of a database that brings together a set of geographical indicators. The more information about the images are collected, the more details can be provided about them. It is then a question of maximizing these images through a plurality of information, whether it is environmental, administrative, or even military.
Why is it important to know the images to train algorithms?
If you train your algorithm on one type of landscape, it will not be efficient on others. For testing, it is mandatory to assess genericity and thus provide an equilibrium in terms of conditions/landscape and quality to have relevant numbers as results.
The concept is characterized by the association of satellite images with GIS analysis. In that way, we enable content knowledge thanks to GIS data, with no visual observation needed.
The objective of this database rests on its role of filter throughout the constant flow of satellite imagery. It is thanks to GIS data that this role is possible.
How did we manage to solve this problem?
The different datasets that have been collected reveal the content of the images according to precise elements. Actually, each part of the information that provides any description regarding the images is relevant in the algorithm’s training.
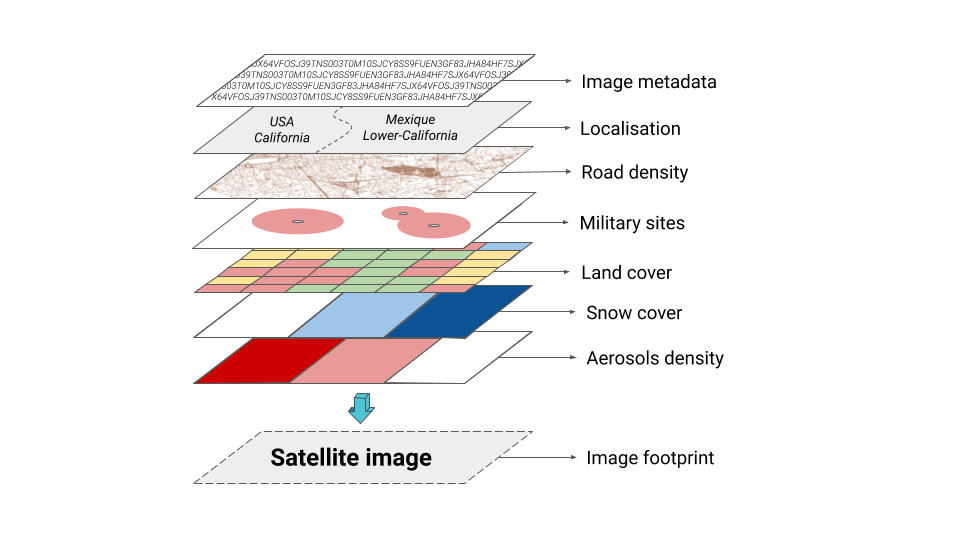
These descriptive parameters are the following:

- Image metadata: image proprieties and satellite information.
- Geographical location: territorial division, from the highest level (country) to the thinnest (town).
- Road density: composition of the global road network.
- Military occupation: location, activity classification and content description of the military installations around the globe.
- Land Cover classification: description of soil occupation. It determines the kind of environment the image is located on.
- Snow cover: presence of snow at a given date.
- Aerosols density: particles in the atmosphere above the observed site (also at a given date).

How does it work, really?
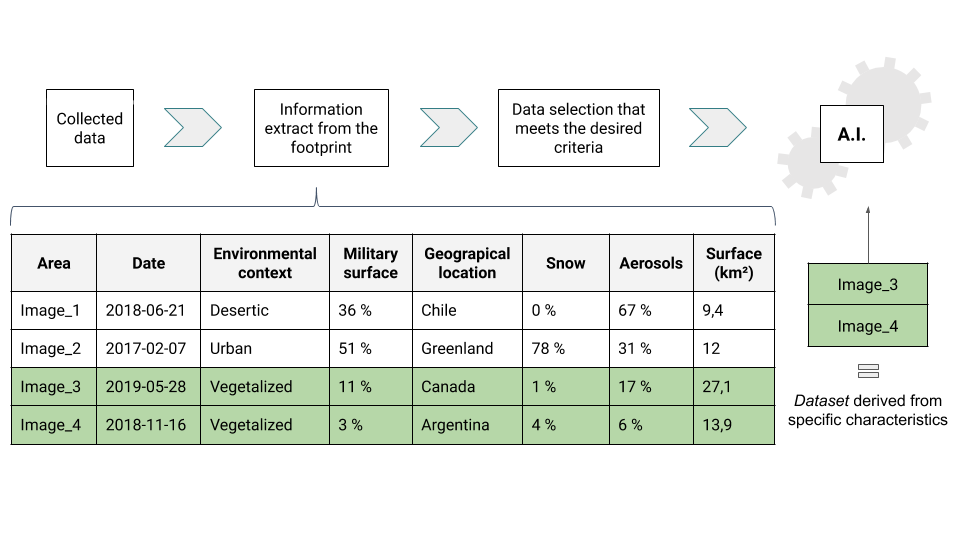
The information is extracted from the images’ footprints. The results will depend on the presence of data within those footprints. Indeed, the collected data can take multiple forms due to the plural and various sources. It can easily be seen as a superposition of multiple rasters and vector layers that cover the entire surface of the globe, on which we cut the only parts that have an interest to us.
From a more technical point of view, the process relies on the formatting of the data extracted from the images footprints. The final form to be given depends on the information that one wishes to bring in order to describe the content of the images. The hard work here relies on a standardization of the attribute tables and a cleaning phase of every data that doesn’t bring the information needed. After that, the extraction of each data depends on the layers’ specificities. Because the whole process is based on the geographical location of the data, the key in this information extraction is the spatial relationship between the layers of data and the images’ footprints.
Hence, we collect the information about each data that crosses an image footprint. To go further, every time a batch of images joins the collection, a Python routine is in charge of scanning the new satellite images and running the description analysis process. This way, the image collection database is upgraded on time for the creation of testing or remaining datasets.

From there, we can take the example of the Land Cover extraction which will give — as a result, the environmental components of the site observed.
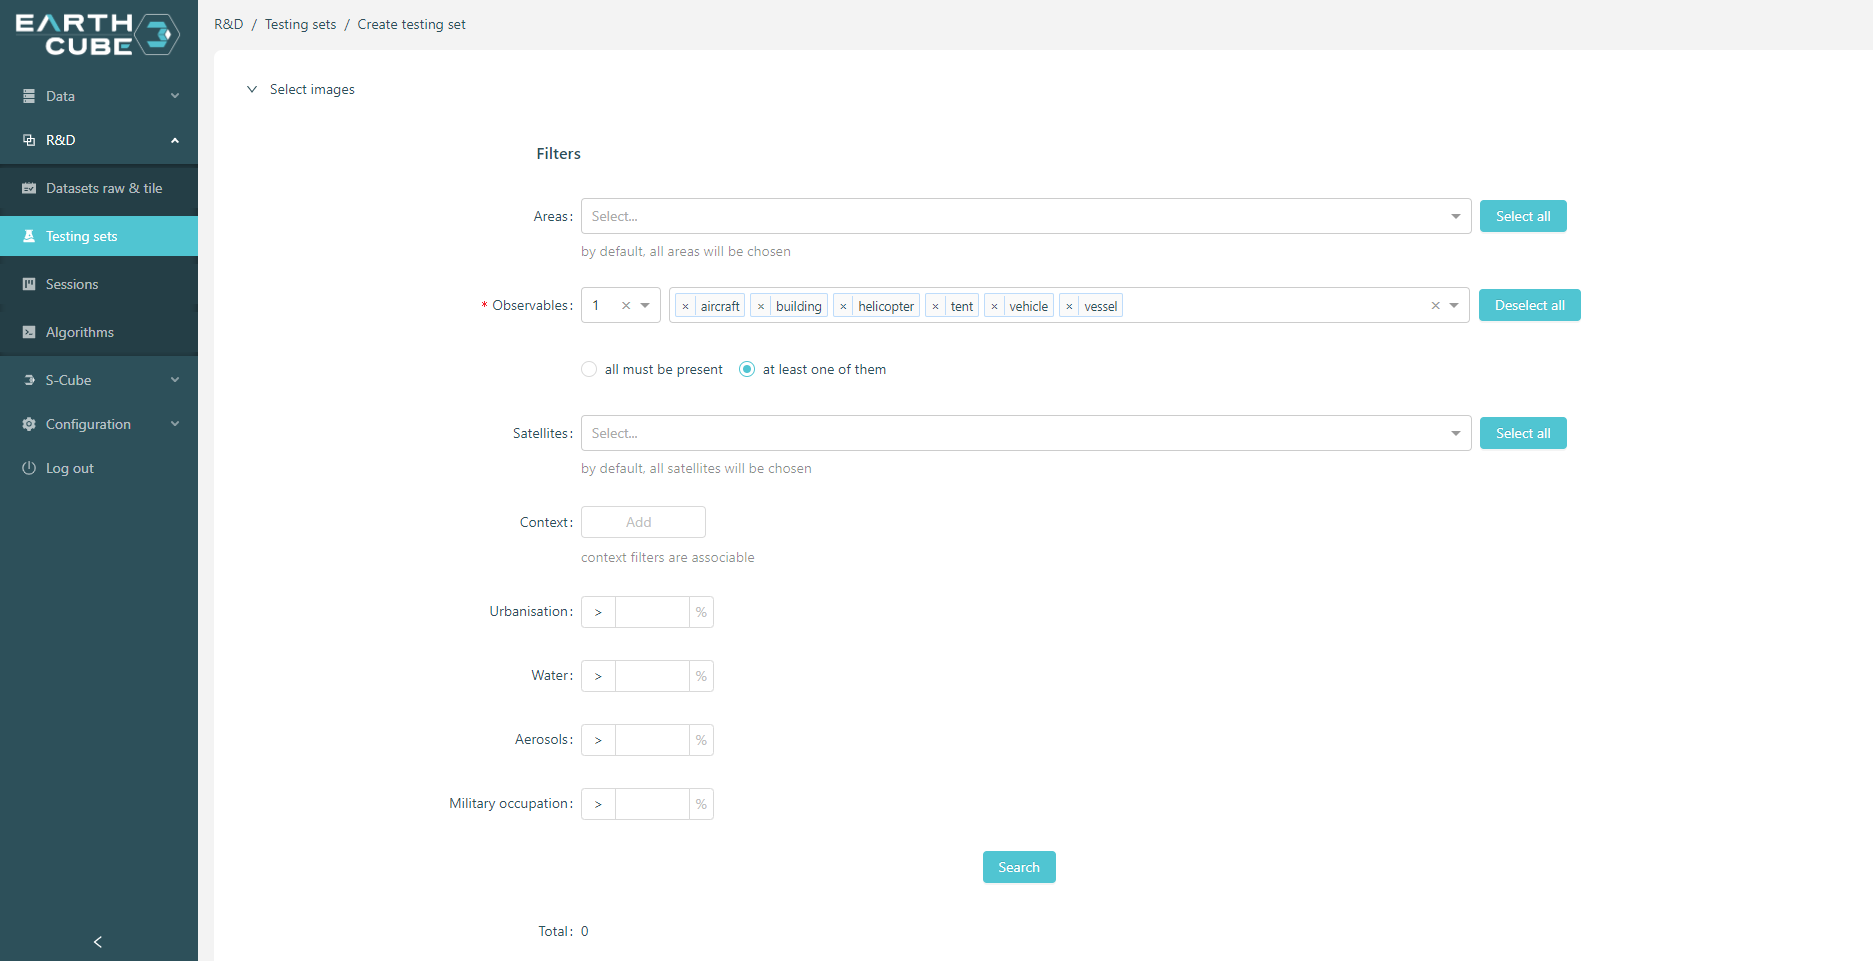
The output is actually percentages, that reflect the different classes which are contained in the image. Thus, the construction of datasets can be done by giving the minimum percentage of a specific chosen class.
Throughout the diversity of their content characteristics, the image classifications thus enable us to build test and training datasets.
The next steps we are working on!
The information that forms the basis of this database represents only the tip of the iceberg. Indeed, the project is not limited to the data that has been processed. It is possible to add relevant criteria to respond to new demands for precision on the content of the satellite images.
This is the reason why the project that has been presented can evolve constantly.

Through all the data that can be put to use, this project illustrates the multidisciplinary dimension embodied by GIS, as well as the complementarity that can be expected with the help of remote sensing.